
The Challenge
CNN’s Fear and Greed Index is one of the most quoted numbers in finance. Traders check it daily, publications cite it, and it has been running for years. It covers the US market and nothing else. Anyone trading the Australian Stock Exchange has no equivalent, and the sentiment data that does exist sits behind terminals that cost more per month than a retail trader makes on a good one.
The idea was to build that missing number for the ASX. Which meant the site could not be a site. A sentiment index is only worth checking if it is current, so the whole thing had to update on its own, every trading day, without anyone logging in. A stale gauge is worse than no gauge at all, because the first time a visitor sees a number three days old they never come back.
The second half of the problem was traffic. An index is a thing people check, not a thing people find. Nobody searches for a gauge they do not know exists, so the site needed a body of financial news around it to bring people in from search in the first place.
What We Built
The index runs on a spreadsheet. Market inputs feed into a Google Sheet where the scoring formulas live, and custom scripts move that value onto the site on a schedule. Keeping the calculation in a sheet rather than buried in PHP was a deliberate choice. The formula behind a sentiment index is not fixed. Weightings get adjusted as the market behaves in ways the model did not expect, and the client can open a spreadsheet and change a weight without a developer touching the site.
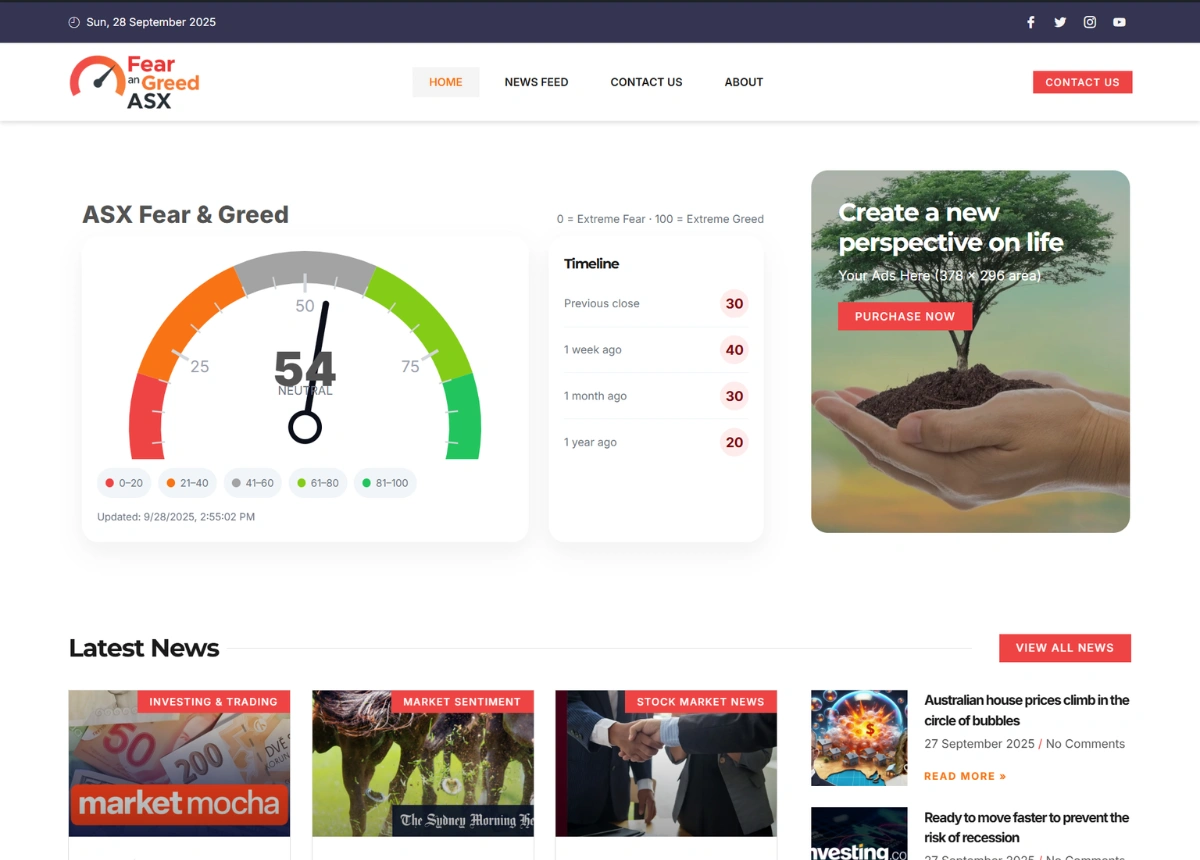
On the front end the value renders as a gauge with five bands running from extreme fear to extreme greed, colour coded so the reading lands before the number is even read. The exact timestamp of the last update sits underneath it, down to the second. On a financial tool that timestamp is the trust signal. It tells a trader the number in front of them is live rather than left over.
Next to the gauge sits a timeline showing the previous close, one week ago, one month ago and one year ago. That panel matters more than the headline number. A reading of 77 means very little on its own, but 77 today against 33 a year ago tells a trader exactly what has shifted, and it turns a single figure into something worth returning to.
The news side runs as an automated blog across four categories: Market Sentiment, Stock Market News, Investing & Trading, and Economy & Policy. Articles publish daily without anyone writing them, which builds the search footprint that carries strangers to a tool they were not looking for.
Monetisation was built in from the start rather than bolted on later. A fixed ad slot sits beside the gauge in the highest attention position on the page, with its own purchase path and an advertise page. A subscription button holds the header. A newsletter block sits in the footer. The gauge brings people back daily, and three separate paths are ready when they arrive.
Built to Run Unattended
Nothing on this site needs a person in it on a normal day. The index updates from the sheet, the news publishes itself, and the ad slot and newsletter run in place.
A light and dark toggle sits in the footer, which is a small thing everywhere except in finance, where people are reading screens at market open and again late at night.